Load Shedding in Clojure
This the second post in a two-part series. In the first part of the series, we discussed the different aspects of load shedding and why it matters to think of it as part of the design of web services. We recommend reading it first as it sets the context for this post. Here, we will implement our load shedding strategy in Clojure and corroborate it with experiments.
Every web service has a finite capacity of work it can do at a time. If this is exceeded, then the performance of the server degrades in terms of response times and availability. As discussed in the previous post, we will attempt to shed load before a service’s capacity is exceeded. We will do this by the following strategy:
- Limit the number of concurrent requests in the system
- Add an upper bound on the response time
- Recover from load by unblocking clients
Conceptual model
In our load shedding server, we want the server container (Jetty) threads to be the liaison between request queueing and request processing. That is, we want Jetty threads to hand off requests to application threads instead of processing it. Jetty threads should only monitor request processing in the system as a whole, part of which is to ensure that excess load is shed when there is too much to process.
The conceptual model for the load shedding server exhibiting the above properties is shown below. The salient aspects of the model are:
- A bounded queue of requests
- Measurement of time spent in the queue
- Measurement of time spent in processing a request
Jetty threads preempt responses for requests which have waited too long either due to too much queueing or due to slow request processing. This ensures that neither the processing time nor the queuing time is too large. Time is measured at the queueing level and the processing level.
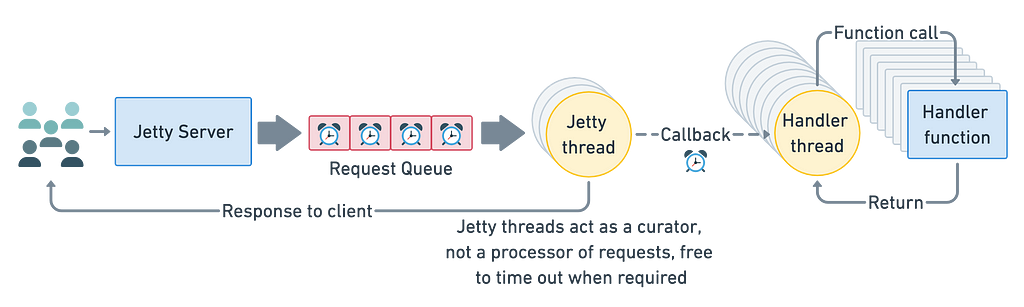 A conceptual model for our load shedding server. The important aspects are: Jetty responds to clients when requests wait too long in the queue or take too long to be processed. Jetty hands off request processing to application handler threads and preempts responses for those requests which take too long.
Load monitoring middleware
In our load shedding server, we will use asynchronous handlers in Jetty to detect and react to load in the system. Our system starts with defining a Jetty server that uses the options :async-timeout-handler and :async-timeout as shown below. :async-timeout-handler is a function which is invoked by Jetty to respond to a request has been in the system for too long (including waiting time and processing time). The amount of time a request is allowed to wait for response is configured by the :async-timeout option. Our server uses Compojure routes, a timeout handler and a timeout value. The Compojure routes themselves or the web application in general is not asynchronous, the asynchronous processing is transparent to the application and is only visible to the middleware — we will describe this in detail in the next sections.
https://medium.com/media/222ee82030830f1cebe17e4a0a832531/hrefIn the above snippet, the app is a Jetty server which uses the wrap-load-monitor middleware. The goal of this middleware is to monitor the current load in the system and drop requests when necessary.
https://medium.com/media/dc632bec8b241525ea83fa11cd6e3aa2/hrefThe purpose of this middleware is to hand off request to the application threads. Jetty threads are only used to liaison between the application threads and waiting requests. The definition of the hand-off-request function will determine how the system behaves to handle load.
If at any time, the hand-off-request does not have the resources to process the request, it is expected to throw a RejectedExecutionException signalling to the load monitor that the request was rejected due to overload. The load monitor then responds to the client with a graceful error code, like 429 above.
With this, the server setup is ready, and we can now look at how we will achieve the three goals we concluded to be necessary for load shedding implementations in the previous post.
Goal #1: Limited concurrent requests
We will use a thread pool which has a bounded queue of tasks while implementing the hand-off-request function used by the load-monitor middleware. To that end, we use the ThreadPoolExecutor class which provides options for specifying the number of threads in the pool and takes a queue in which pending tasks wait.
https://medium.com/media/4ce42b9c202c0b4bdc2e658996fccc45/hrefWe are using an ArrayBlockingQueue to limit the number of pending tasks for this thread pool. This ensures that there will be an upper bound on the number of tasks that can be waiting for a thread. An alternative to this is to use a SynchronousQueue, in which case there will be no queueing in the application thread pool and tasks which cannot be served immediately are rejected. By and large, the choice of queue sets the strategy for shedding load when the number of concurrent requests reaches its limit.
https://medium.com/media/fd8ab25678828cdf332465123e992095/hrefTo sum up, Jetty hands off request processing to the request-processor-pool which is a thread pool with a bounded queue. At any time, if there are too many requests in the system, the request-processor-pool will reject the task which the load-monitor middleware will handle by gracefully responding to the client with an error status. Therefore, the number of concurrent requests in the system is always limited.
Goal #2: Bounded response time
The response time as seen by the client is a sum of the time a request waits for service and the time it takes to process the request. The goal is to ensure the total time a client waits for a response is bounded.
Let us now define the behaviour of hand-off-request to see how we can achieve the property of having a bounded response time. In the snippet below, hand-off-request converts the asynchronous handler that Jetty sees into a synchronous handler since the rest of the application code is written to process requests synchronously. This may not be necessary if the application is asynchronous to start with. The asynchronous nature of the Jetty handler used in this example, is only visible to the load-monitor middleware. This approach to load shedding can be applied to any web server written in Clojure/Ring without affecting the rest of the code or business logic — the asynchronous nature of the handler is abstracted away from the application implementation.
In the snippet below, we define hand-off-request to be function that runs on the application thread pool request-processor-pool and it detects delays in queueing based on which it decides whether to process the request or drop it due to delay. We are using a custom fork of Ring where we have added :request-ts-millis as a key to the Ring request map. This timestamp is derived from Jetty’s getTimeStamp method that records the time a request came into the system (prior to queueing). We use this to check if a request has waited too long in the request queue.
https://medium.com/media/5e586bfc3a54c86f9313460f55ddb9a5/hrefWith this mechanism, a request that has been waiting too long in the queue is not processed at all and is dropped. Since we are using Jetty’s asynchronous handlers with a timeout, whenever a request takes longer than the configured value, the client will get the response as determined by :async-timeout-handler defined when creating the Jetty server (as shown in the above sections). If the request has already waited too long in the queue, it is not even picked up for processing, which gives the server headroom to recover from load that has piled up.
The load monitor middleware ensures that the application seen by Jetty is an asynchronous one. This allows us to set a limit on the request processing time. If a request takes longer than this time, the client will be responded to by the :async-timeout-handler independent of the request processing itself, so that clients will never wait longer than a configured timeout. This is a change we made to our fork of Ring to support load shedding.
Goal #3: Recover from load by unblocking clients
Whether it is the processing of the request that has become slow, or if it is that there is a sudden surge of incoming requests which is causing traffic to get jammed, the Jetty container will respond to the client irrespectively with the preconfigured timeout response as determined by :async-timeout-handler. Therefore, clients never wait for too long to get a response. More importantly, this ensures that clients will not hold on to resources on the server when the load increases. This frees up resources which helps recover from load once the cause for the load has subsided.
The entire source code for our implementation is available here. We are using a custom fork of Ring with the above changes, which has been discussed in this pull request: https://github.com/ring-clojure/ring/pull/410. The pull request has been merged with some of the changes required for this implementation.
Experiment #1: Sudden bursty traffic
To demonstrate our load shedding server implementation, we created a setup with two servers, one with load shedding enabled and one without. Other than this, everything else — including the handler functions, clients making requests — were identical for both servers. The source code used for these results is available on Github.
- The black vertical lines in the graphs that follow denote the duration of the load in the system — a sudden burst of requests which lasted for under a minute.
- The response time was set to be 3 sec, that is the handler took exactly 3 sec to respond to each request.
Perceived response time during bursty traffic
Let us look at the time taken to get a response, as seen by the client for both servers.
- For the non-load shedding server, the response time rose to as high as 3 min on average although the processing time was constantly 3 sec (plotted as “request handling time”).
- The effect lasted much longer than the cause itself. It took more than 3 min for the non-load shedding server to recover from a burst that lasted less than a minute.
- For the load shedding server, there was a dip in the response time during the duration of the load. This is because after the system was saturated, requests were not even picked up for processing, skewing the measurement of response time. The load shedding server never took longer than 3 sec to respond to the client, which is the time the request processing was set to take.
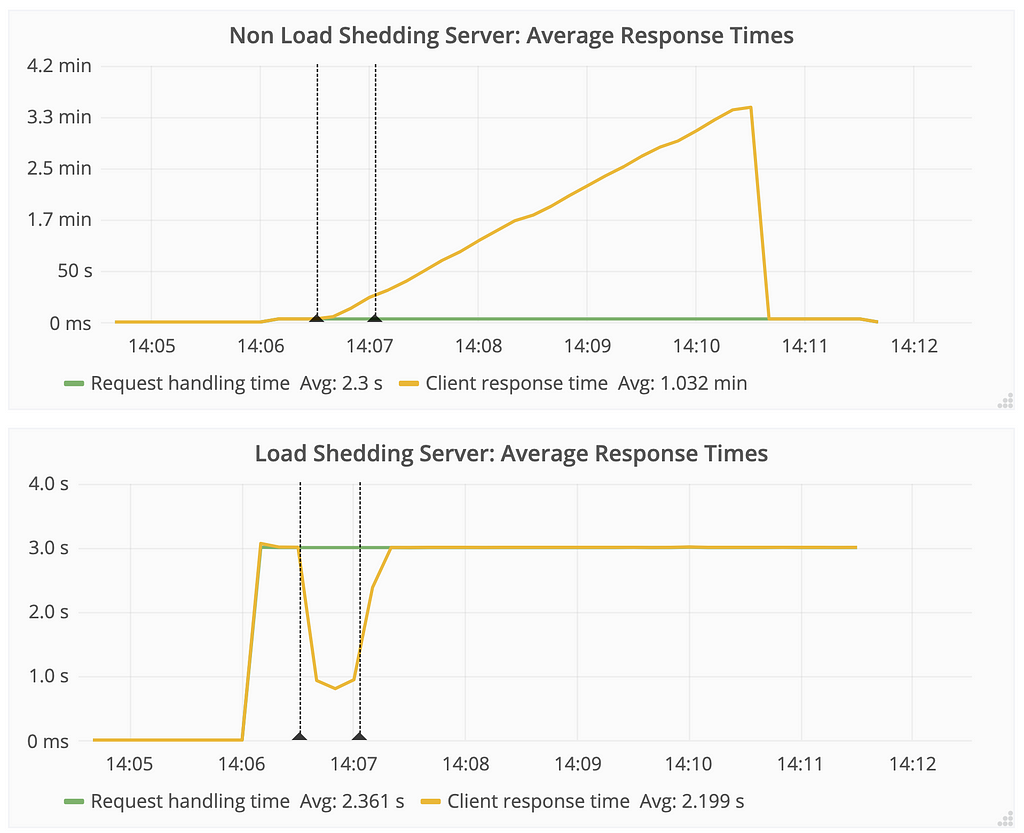 Response time climbs for the non-load shedding server even after the sudden burst of requests ended. While the time taken to process requests remains constant, the response time perceived by the client is ever-increasing. The load shedding server ensures that the client never sees a high response time.
Response codes during bursty traffic
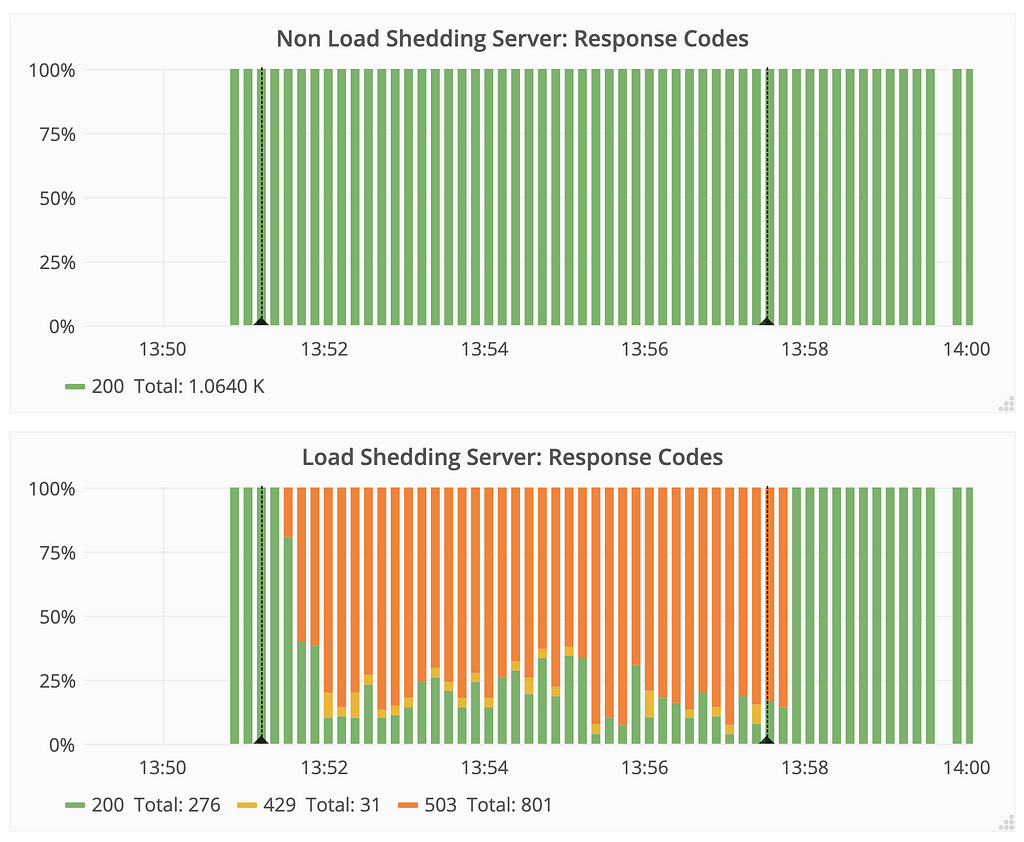
Let us now compare the response codes seen by the clients during the bursty load.
- The non-load shedding server was unreachable from the client when the load became too high (denoted as “FAIL” when the server refused connections).
- The load shedding server quickly recovered after the burst and came back to normal behaviour. As per our implementation, the statues of 429 and 503 statuses signify too many requests being made and requests taking too long to be processed respectively. This only happened during the the burst of requests, after which the server regained full functionality.
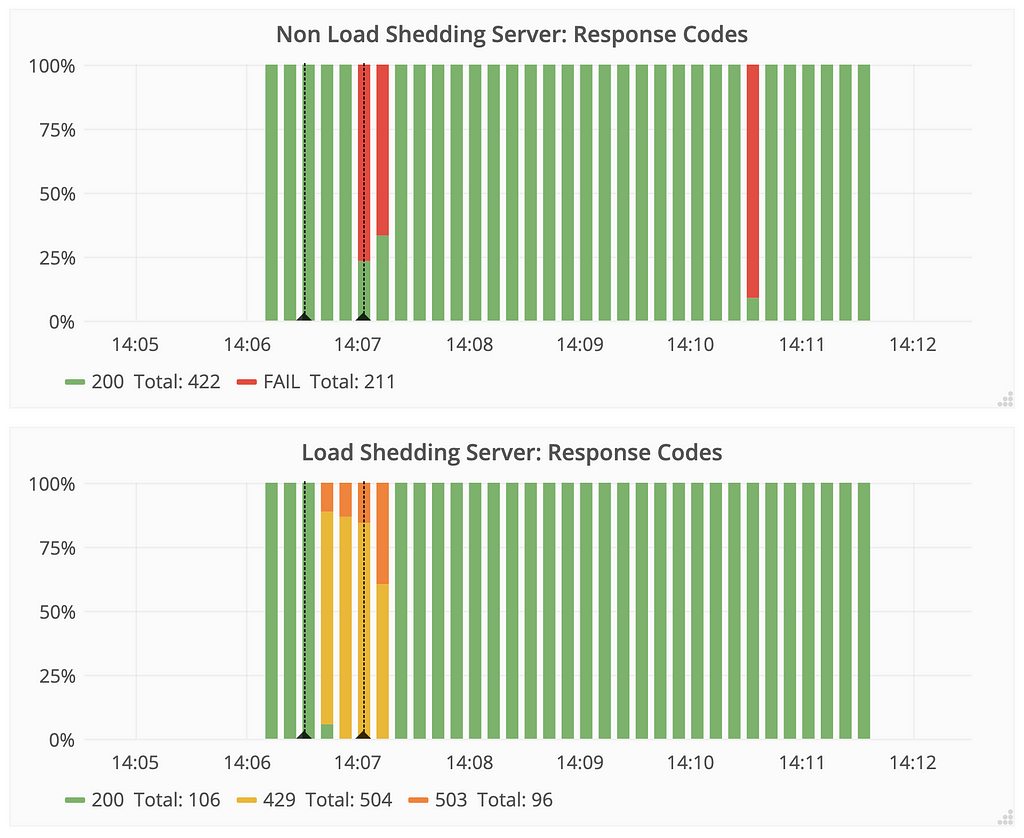 The non-load shedding server reports no error code until its queues are full at which point it stops accepting requests, which is a bad experience for its users. The load shedding server ensures that the load is communicated to the clients with graceful error codes and it recovers to full functionality after the surge ends.
Bursty traffic: Summary
This first experiment demonstrated the behaviour of the load shedding server and the non-load shedding server when there is a sudden burst of traffic. To summarise:
- A non-load shedding server can become very slow during a sudden burst of requests. The impact on the server response time can last much longer than the load itself.
- If the load is too high, the non-load shedding server can become entirely unresponsive.
Experiment #2: Degraded downstream dependency
In our second experiment, keeping the rate of requests was constant, we increased the request handling time to simulate a degraded downstream dependency.
- There were two routes: one was set to take 3 sec and the other was constantly set to take less than 1 sec.
- After a while (at the first dotted black line) the slow route was increased from 3 sec to 4 sec. The fast route was kept as is.
- The processing duration of the slow route was brought back down to 3 sec after 6 min (at the second dotted black line).
- Both routes on both servers were called the same number of times at the same rate.
Perceived response time during degraded downstream
As with the first experiment, we will first compare the response time as seen by the clients.
- For the non-load shedding server, requests took as long as 25 sec to respond while it should have taken at most 4 sec. The “request handling time” never rose above 4 sec.
- The load shedding server never blocked a client longer than 6 sec, a pre-configured value.
- Both servers recovered quickly after the degraded dependency was resolved.
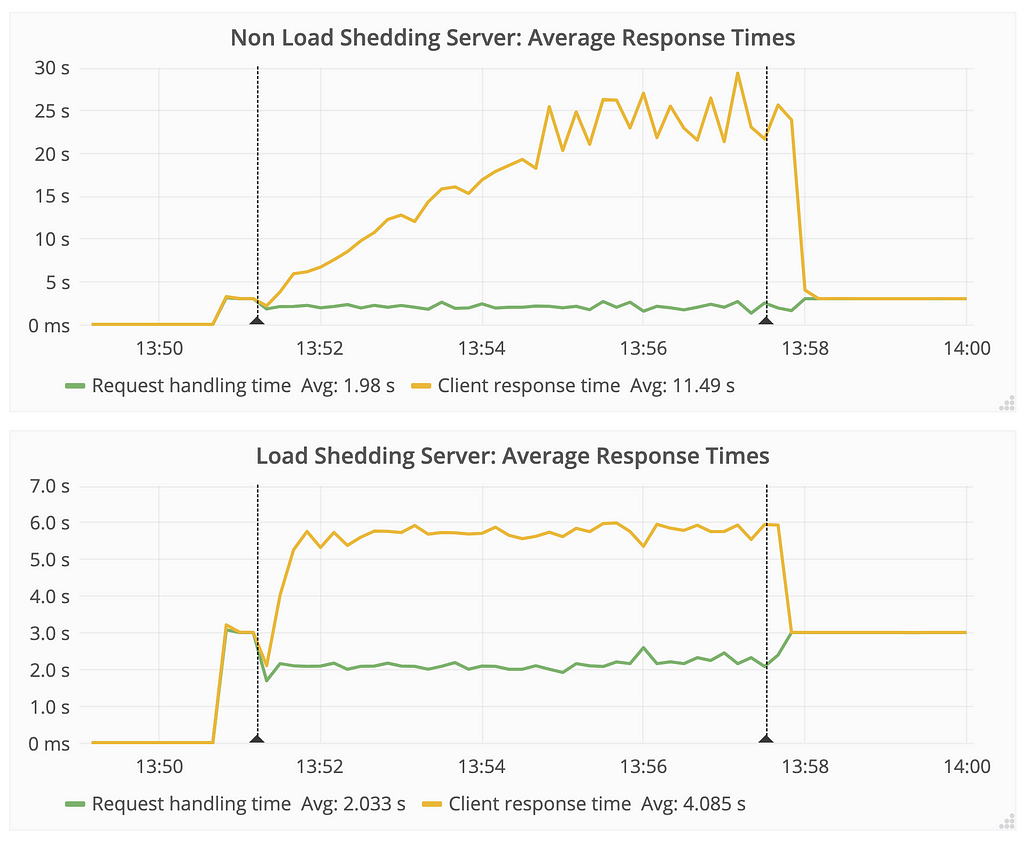 The response time for the non-load shedding server increases manifold when there is a degraded dependency (from 4 sec to 25 sec). The load shedding server ensures that the client never sees a response time higher than 6 sec, which is a preconfigured value. Note: The average value for “request handling time” is an average of both the slow and fast routes and is therefore less than 3 sec.
Response codes during degraded downstream
In this section we compare the response codes received by the clients for both types of servers during a degraded dependency.
- The non-load shedding server never reported an error status, but this does not indicate the user experience. This is a misleading status because the client is most likely experiencing a delay or timing out, while the server is unaware and is reporting no error status.
- The load shedding server responded with a status of 503 when requests had waited too long and 429 when there were too many incoming requests. The load shedding server was able to detect that there were more requests in the system than it is configured to handle.
 The non-load shedding server does not report any error code, while the response time keeps increasing silently. This is a slow poisoning in the system which can go unnoticed while the clients face delays. The load shedding server ensures that it communicates errors gracefully to the client and recovers after the degraded service is back to normal capacity.
Degraded downstream: Summary
In this experiment, we simulated a degraded dependency by increasing the processing time of a route and observing the impact on the two servers.
- Without load shedding, response times seen by clients can keep increasing when there is a degraded dependent service.
- The non-load shedding server does not report any error code and lets the load build up in the system. This may be a silent killer because the application is not able to notice this degradation but its clients notice significant delays.
Further improvements
We looked at load shedding from the perspective of protecting our system against unprecedented load. But other factors may be taken into consideration to make the load shedding more tuneable.
- Cost analysis of shedded load: The Google SRE blog rightly calls this kind of load shedding a one-size-fits-all Procrustean load shedding. In our approach, we rejected any request that arrived after a threshold was exceeded. There may be other considerations to make: some routes may be more impactful or non-retriable and should be shed last, or we might want per-route load shedding strategies.
- Localisation of load: Some problems may be solved with a more granular level of control that constructs like circuit breakers can provide. Localised problems like slowness in one database which is used for a small fraction of requests can be better handled by employing circuit breakers which have a more intimate relationship with the application logic than load shedding.
- Dynamic load shedding: We hard-coded the threshold of the number of requests that are open in the system. Deciding this number for production can be difficult, primarily because the performance characteristics of services changes over time and varies between services. A more dynamic approach might be better suited which relies on properties which can be tuned on the fly. For example, TCP congestion control changes its window size (the number of packets that are allowed to be in-flight) by the AIMD algorithm, where the window size is increased linearly when packet delivery is successful and is reduced exponentially when packets fail to be acknowledged (when there are too many in-flight packets).
Conclusion
In this post, we showed how to implement load shedding in a web service written in Clojure. Our implementation of load shedding used asynchronous Jetty handlers and a load monitoring middleware to detect a high load scenario and shed extra load so as to preserve the quality of the service as well as prevent a cascading effect of failure from one service to another.
This concludes this two-part series on load-shedding in web services. You can find the first part here which talked about load shedding in general. To summarise this series:
- Load shedding is a pre-mortem strategy to minimise service during extreme load, in the interest of preventing a wider incident or a collapse of the service entirely.
- Capacity planning should be part of the design of high throughput web services.
- A simple but effective strategy can go a long way in preventing cascading failures.
- Queueing time, processing time and the number of concurrent requests need to be bounded during high load scenarios.
- Jetty’s asynchronous handlers and Ring’s middleware can be used to make any Clojure web service shed load without changing the application code.
The code used in this post is available on Github, and its dependent fork of Ring is available here.
Load Shedding in Clojure was originally published in helpshift-engineering on Medium, where people are continuing the conversation by highlighting and responding to this story.