在Reagent里使用Highchart

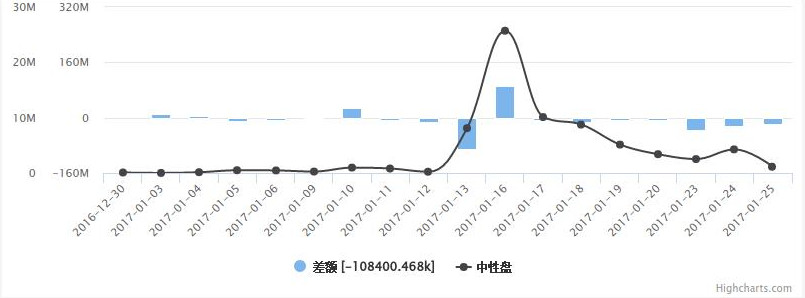
使用Reagent时,DOM的更新完全交由Reagent处理,但如果我们想要自定义DOM解析,比如使用第三方JavaScript库时该如何做呢?本文以使用Highchart绘制股票资金流图表为例,演示如何在保留Reagent优势的同时使用第三方库。

 (ns example.reagent-highchart   (:require    [reagent.core :as reagent]    [reagent.ratom])) (enable-console-print!) (def hidden-cashflow-data [{:buy 21270935, :sell 23167507, :neutral 90084, :date "2016-12-30", :ts 1483027200000} {:buy 29073411, :sell 18710786, :neutral 16367, :date "2017-01-03", :ts 1483372800000} {:buy 39632100, :sell 33587968, :neutral 142116, :date "2017-01-04", :ts 1483459200000} {:buy 30397652, :sell 38781816, :neutral 499603, :date "2017-01-05", :ts 1483545600000} {:buy 37496148, :sell 43923352, :neutral 464833, :date "2017-01-06", :ts 1483632000000} {:buy 25805938, :sell 28843787, :neutral 260935, :date "2017-01-09", :ts 1483891200000} {:buy 75135381, :sell 48004766, :neutral 974686, :date "2017-01-10", :ts 1483977600000} {:buy 41954122, :sell 48454612, :neutral 810701, :date "2017-01-11", :ts 1484064000000} {:buy 30737080, :sell 44291113, :neutral 229681, :date "2017-01-12", :ts 1484150400000} {:buy 79257847, :sell 170156431, :neutral 8099464, :date "2017-01-13", :ts 1484236800000} {:buy 332260150, :sell 240040132, :neutral 25712878, :date "2017-01-16", :ts 1484496000000} {:buy 162327191, :sell 170115086, :neutral 10112900, :date "2017-01-17", :ts 1484582400000} {:buy 126760410, :sell 139314230, :neutral 8746420, :date "2017-01-18", :ts 1484668800000} {:buy 118051959, :sell 123900649, :neutral 5136435, :date "2017-01-19", :ts 1484755200000} {:buy 104657499, :sell 112369701, :neutral 3399244, :date "2017-01-20", :ts 1484841600000} {:buy 64217009, :sell 101009571, :neutral 2517380, :date "2017-01-23", :ts 1485100800000}]) 

首先定义需要用到的状态变量。注意要用defonce

(defonce cashflow-state (atom []))

定义承载图表的div元素:

(defn chart-holder [dom-id & _]
  (fn [dom-id & _]
    [:div {:id dom-id}]))

定义HighChart的参数,

(defn hs-options [xs]
  (let [dates (map :date xs)
        diff (/ (- (reduce + (map :buy xs)) (reduce + (map :sell xs)) ) 1000.0)
        xts (map :ts xs)]
    {:chart {:zoomType "x"}
     :title "资金流"
     :xAxis {:categories dates :crosshair true}
     :yAxis [{:title "资金流"}
             {:title "中性盘"}]
     :tooltip {:shared true}
     :series [{:type :column :name (str "差额 [" diff "k]") :data (map #(- (:buy %) (:sell %)) xs)}
              {:type :spline :name "中性盘" :data (map #(% :neutral %) xs) :yAxis 1}]}))

reagent/create-class创建组件。因为hs-options返回的是Clojure数据结构,传给Highcharts.charts时不要忘记用clj->js转换为JavaScript对象。

(defn cashflow-chart [dom-id]
  (let [update-me(fn [] 
                   (let [chart (.chart
                                js/Highcharts
                                dom-id
                                (clj->js (hs-options @cashflow-state)))]
                     (.setSize chart 800 300)))]
    (reagent/create-class
     {:reagent-render #(chart-holder dom-id @cashflow-state)
      :component-did-update update-me
      :component-did-mount update-me})))

现在把图表显示出来:

(reset! cashflow-state hidden-cashflow-data)
(swap! cashflow-state conj {:buy 109650234, :sell 134822895, :neutral 4267390, :date "2017-01-24", :ts 1485187200000} )
(swap! cashflow-state conj {:buy 43788438, :sell 61379570, :neutral 1130792, :date "2017-01-25", :ts 1485273600000})
[cashflow-chart "myklipse-chart1"]

Highchart with ClojureScript

细心的同学会发现在cashflow-chart函数的定义里,传递给:regent-render匿名函数的参数@cashflow-state似乎是多余的,也就是这一行:

:reagent-render #(chart-holder dom-id @cashflow-state)

这样做是为了保证在cashflow-state的状态改变时,reagent能收到通知,以便更新DOM。

参考

Timothy Pratley的文章对Reganet的使用作了深入的解说,值得仔细阅读。

Comment